 Session Recordings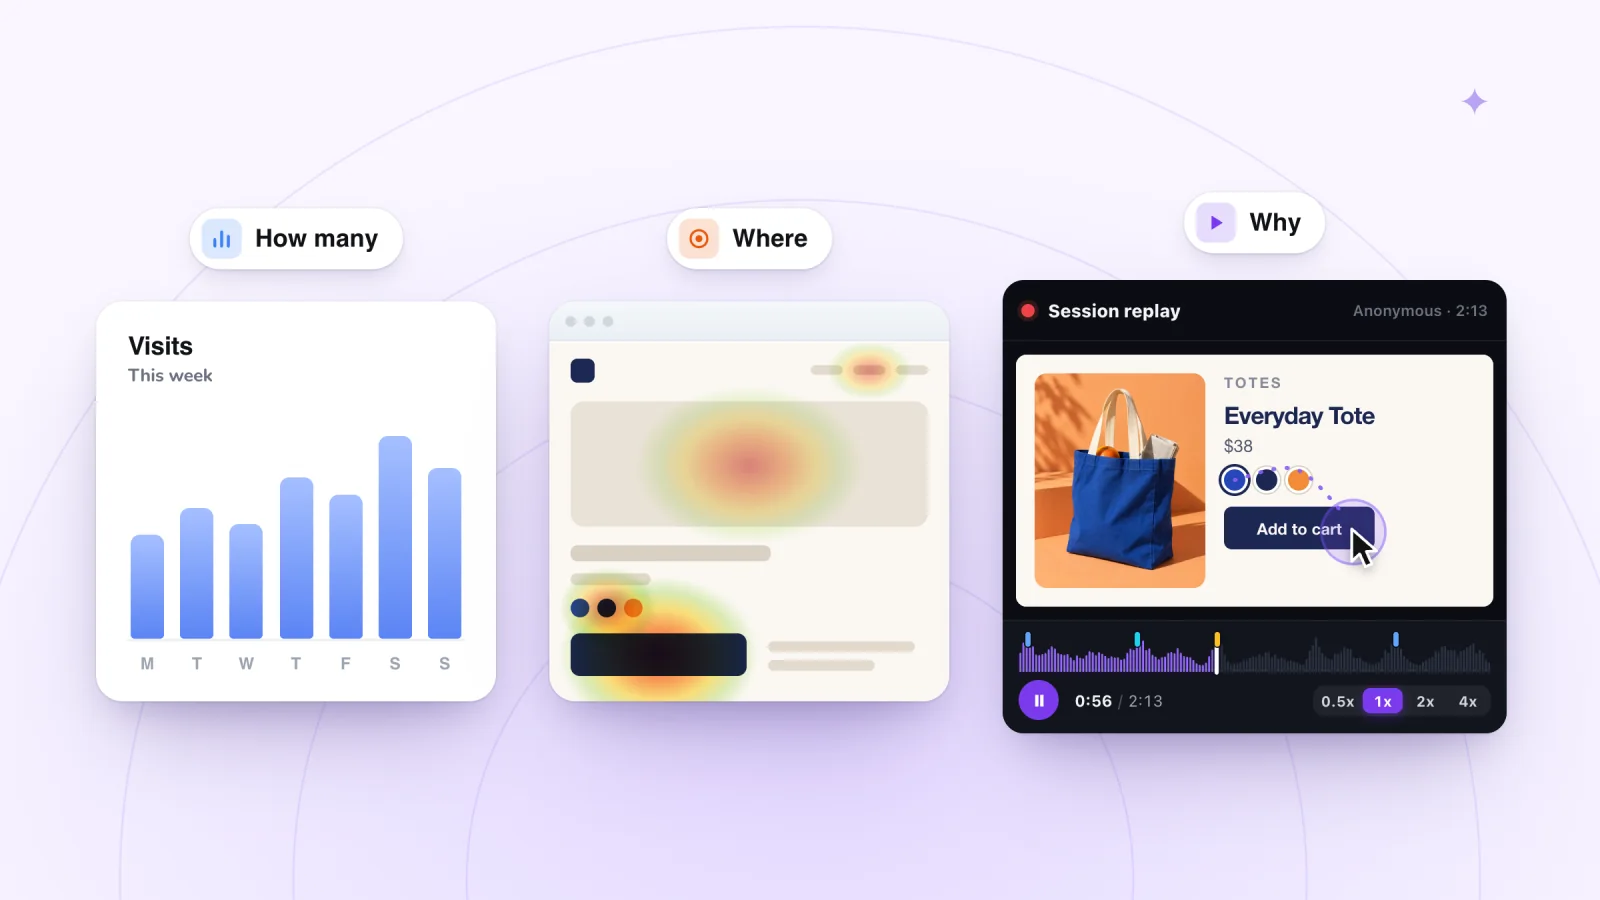
On this page
- Analytics count what happened
- Heatmaps summarize one page
- Session recordings replay single visits
- Side by side
- Which one to reach for
- A simple loop for using them together
- How much time each one asks of you
- Mistakes to avoid
- If you can only start with one
- Getting heatmap-style answers from recordings
- Frequently asked questions
- Try it on your site
Three kinds of tools promise to show you what visitors do on your site. Each one answers a different question, and reaching for the wrong one wastes time. Here is what analytics, heatmaps and session recordings do well, where each falls short, and how they work together.
Key takeaways
- Use analytics to find where visitors drop off, then watch recordings of that page or step to see what happens.
- Fix one thing based on what you saw, then check analytics to see whether the number moved.
- Check how often a problem happens before you redesign around one memorable replay.
- Ask visitors directly, with a one-question survey or a reply to your order email, when you need reasons.
Analytics count what happened
Analytics tools add up visits. They tell you how many people came, where they came from, which pages they saw, and how many bought or signed up. They show trends over days, weeks and months.
Good at. Spotting changes, like a sudden drop in sales from one traffic source. Finding the page or step where people leave. Comparing campaigns, devices and sources.
Weak spot. Analytics deal in totals. A number can tell you that people leave your shipping page. It cannot tell you what they were doing when they left.
Say your analytics show that visitors from a newsletter reach a product page and then leave. That is a useful clue, and it is also where the counting stops.
Numbers also differ between tools, since each one counts and credits visits its own way. If your store and email reports have ever disagreed, this explainer covers why store and email revenue reports disagree.
Heatmaps summarize one page
A heatmap gathers clicks, taps or scrolling from many visits to a single page and paints them as colors. Warm areas drew attention. Cool areas drew little.
Good at. Showing which parts of a page draw clicks, which links get ignored, and how far down the page people tend to scroll.
Weak spot. A heatmap has no order. It cannot show what someone did before or after a click, or how they moved between pages. Pages that change as you use them, with pop-ups, opening menus or rotating banners, can produce confusing maps.
Session recordings replay single visits
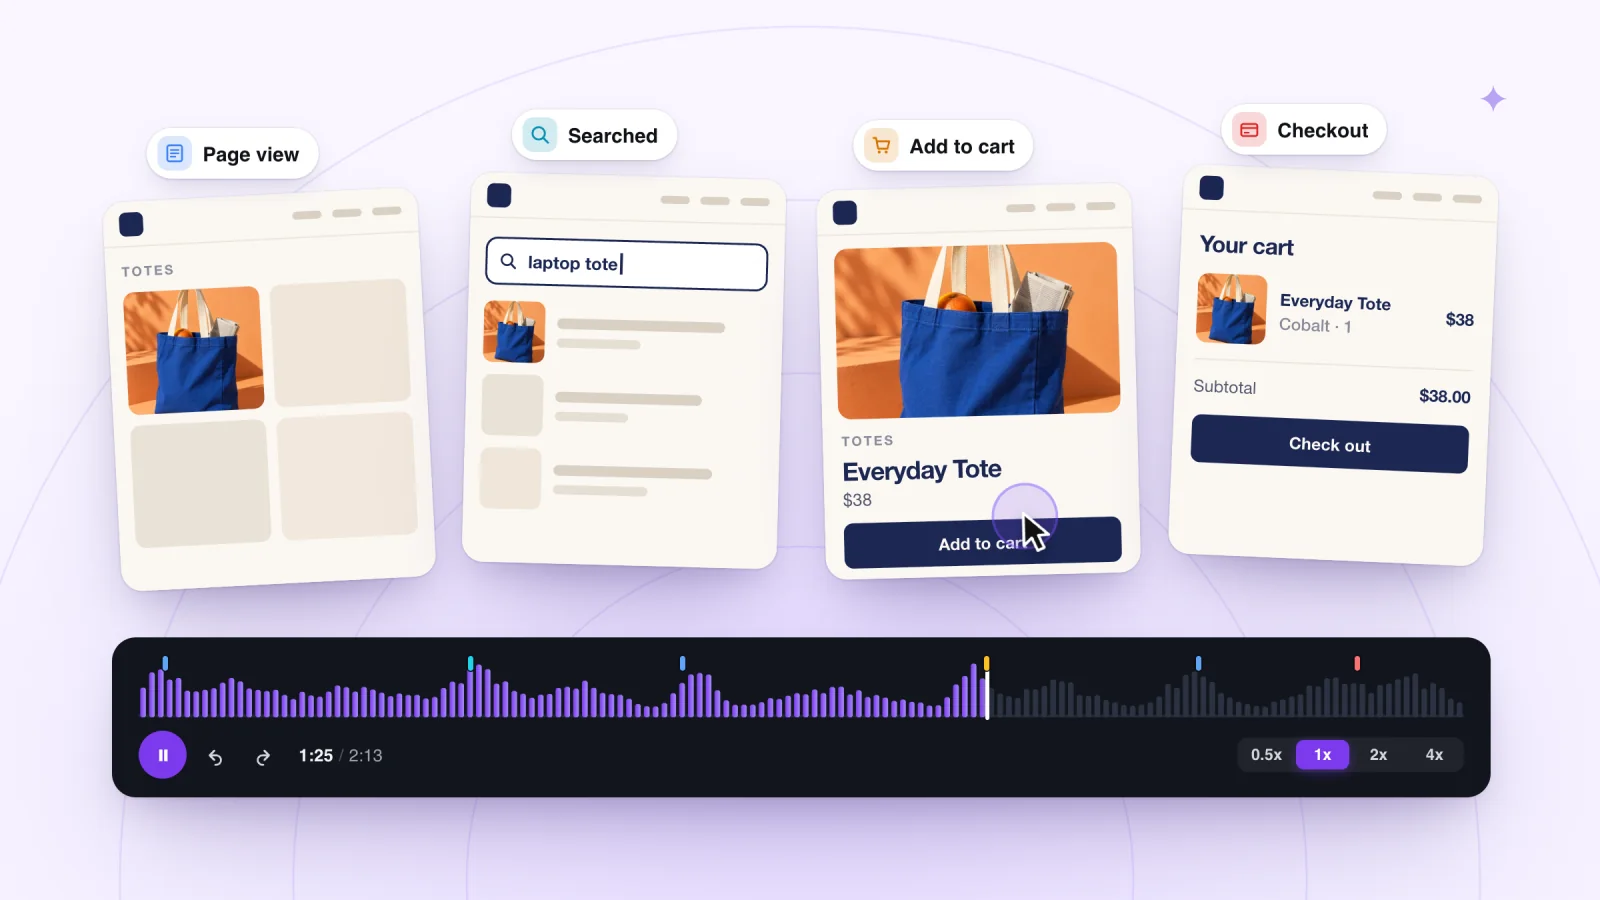
A session recording rebuilds one visit from the page's own structure and events, so you can watch it back. You see the pages, clicks, scrolling and taps in the order they happened. The guide to what session recording is explains how that works.
Good at. Showing the story behind a number. Replays show where a visitor hesitated, what they tried first and what broke. Of the three, recordings are the one that lets you watch a single visit from the first page to the last.
Weak spot. Each replay is one person. Watching enough visits to see a pattern takes time, and one memorable visit can feel more typical than it really is.
Side by side
| Compare | Analytics | Heatmaps | Session recordings |
|---|---|---|---|
| Main question | How many, and from where | Where on this page | What happened in this visit |
| What you look at | Totals and trends | One page, many visits combined | One visit at a time |
| Each click, in order | No | No | Yes |
| Movement across pages | As paths and counts | Not shown | The whole visit |
| Best for | Trends, sources and drop-offs | Layout and attention | Bugs, confusion and context |
| Main limit | No detail about behavior | No sequence | Slow to cover many visits |
Which one to reach for
- A number dropped. Start with analytics to find where. Then watch recordings of visits to that page or step to see how.
- A page underperforms and you suspect the layout. A heatmap shows where attention goes. Recordings show whether people struggle with what they find.
- Someone reports a problem. Go to recordings. You need to see the exact visit.
- You want to know if a campaign worked. Use analytics, and tag each campaign's links so it is counted on its own.
- A launch or a sale is happening right now. You can watch visits live, a few seconds behind real time, and see how people handle it as it happens.
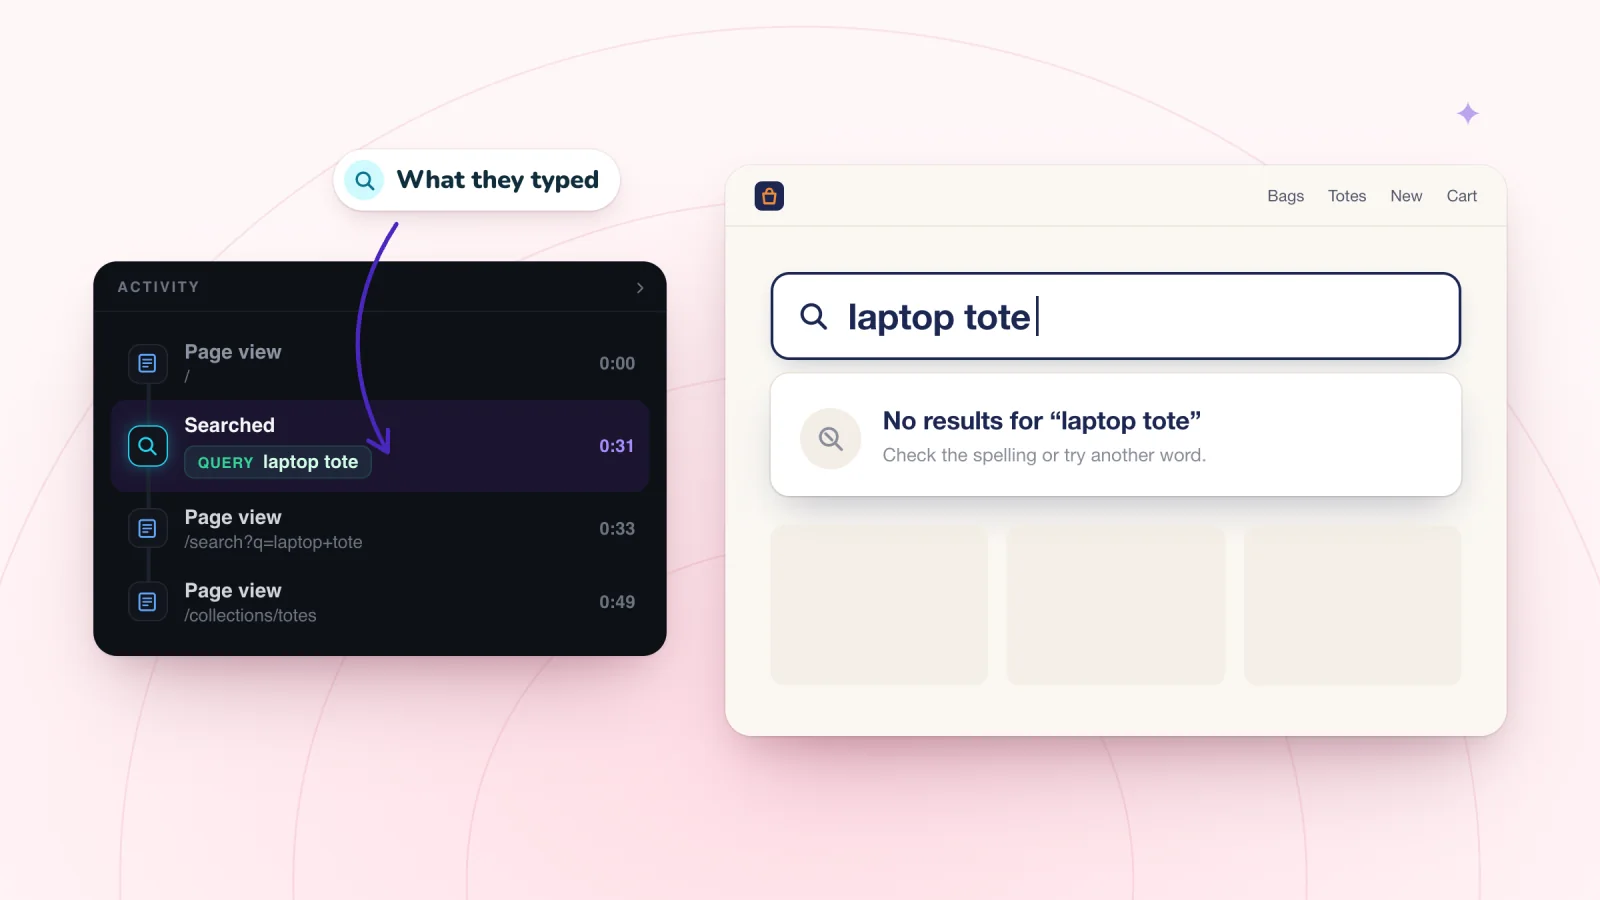
- You want to know what people search for. A recording tool that shows search terms lets you see the words and what each visitor did next.
Session recordings, private by default
Typing is masked in the visitor's browser and recording follows your cookie banner. Free plan included.
Add to Wix, it's free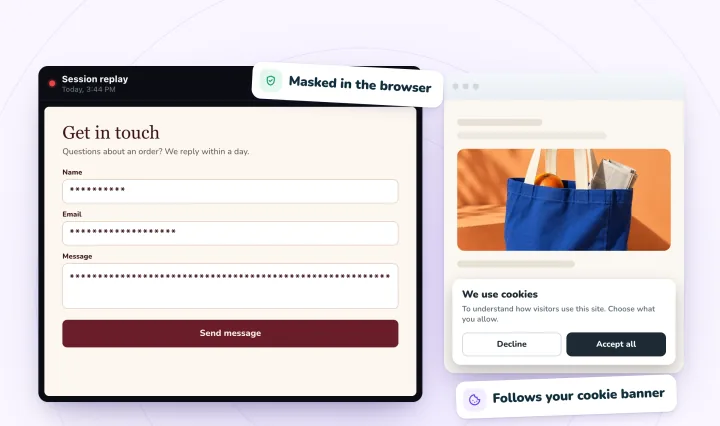
A simple loop for using them together
- Spot. Analytics shows where people drop off.
- See. Recordings show what they do there.
- Change. Fix one thing based on what you saw.
- Measure. Analytics shows whether the number moved.
The loop works with or without heatmaps. Recordings do the seeing, and analytics do the counting.
How much time each one asks of you
Analytics are quick to check once they are set up. A glance at a report takes minutes. Heatmaps are quick per page, but a page needs plenty of visits before the colors mean much.
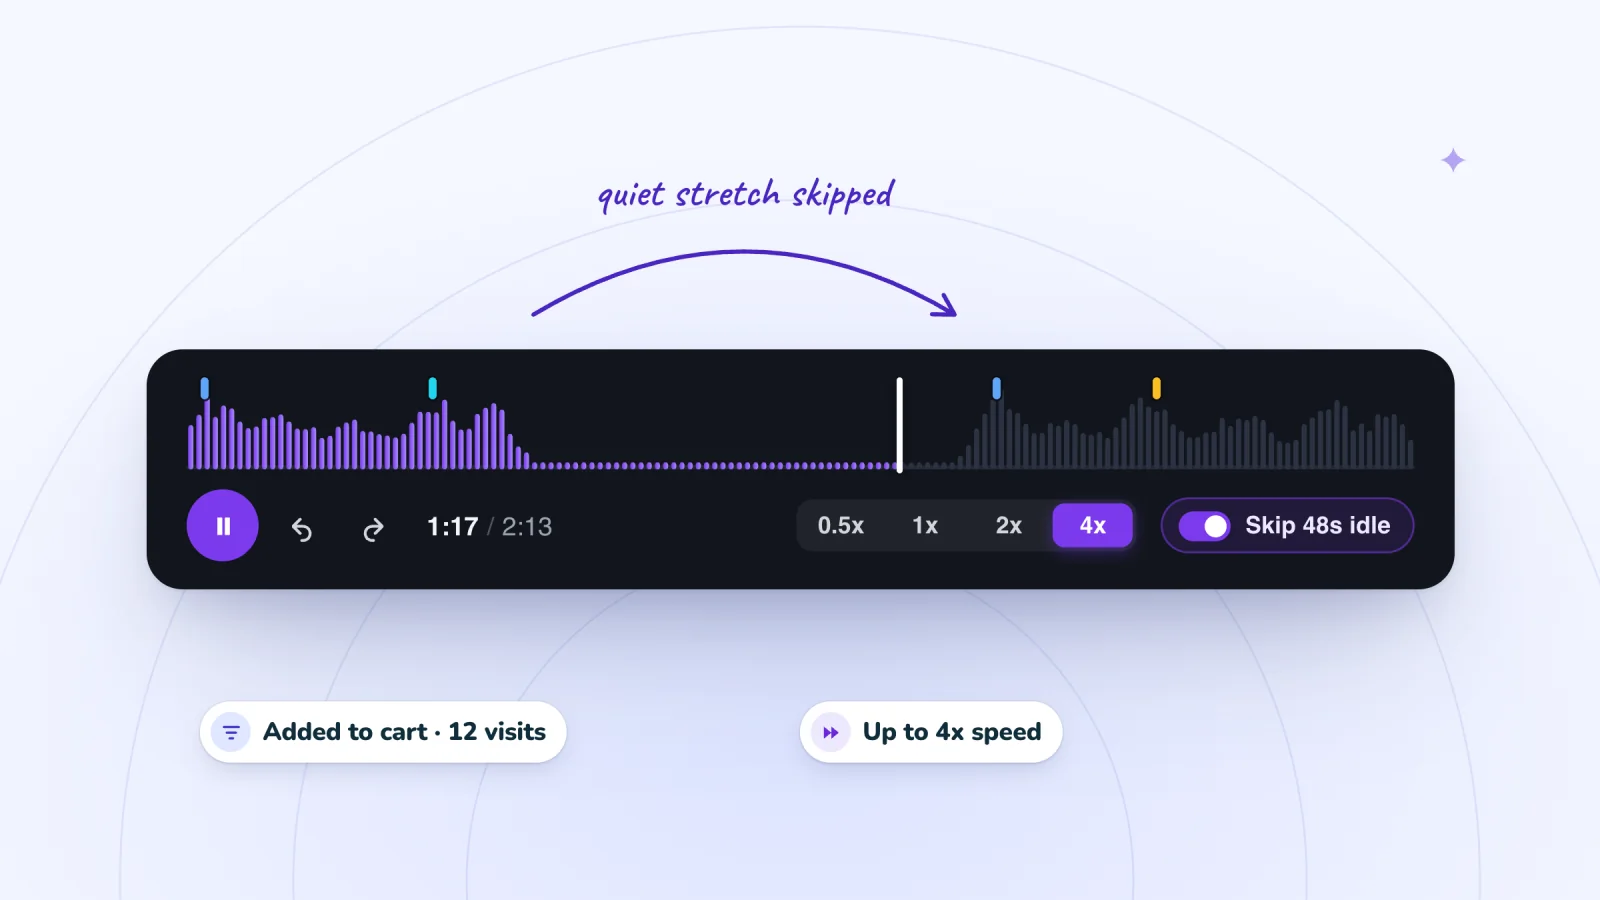
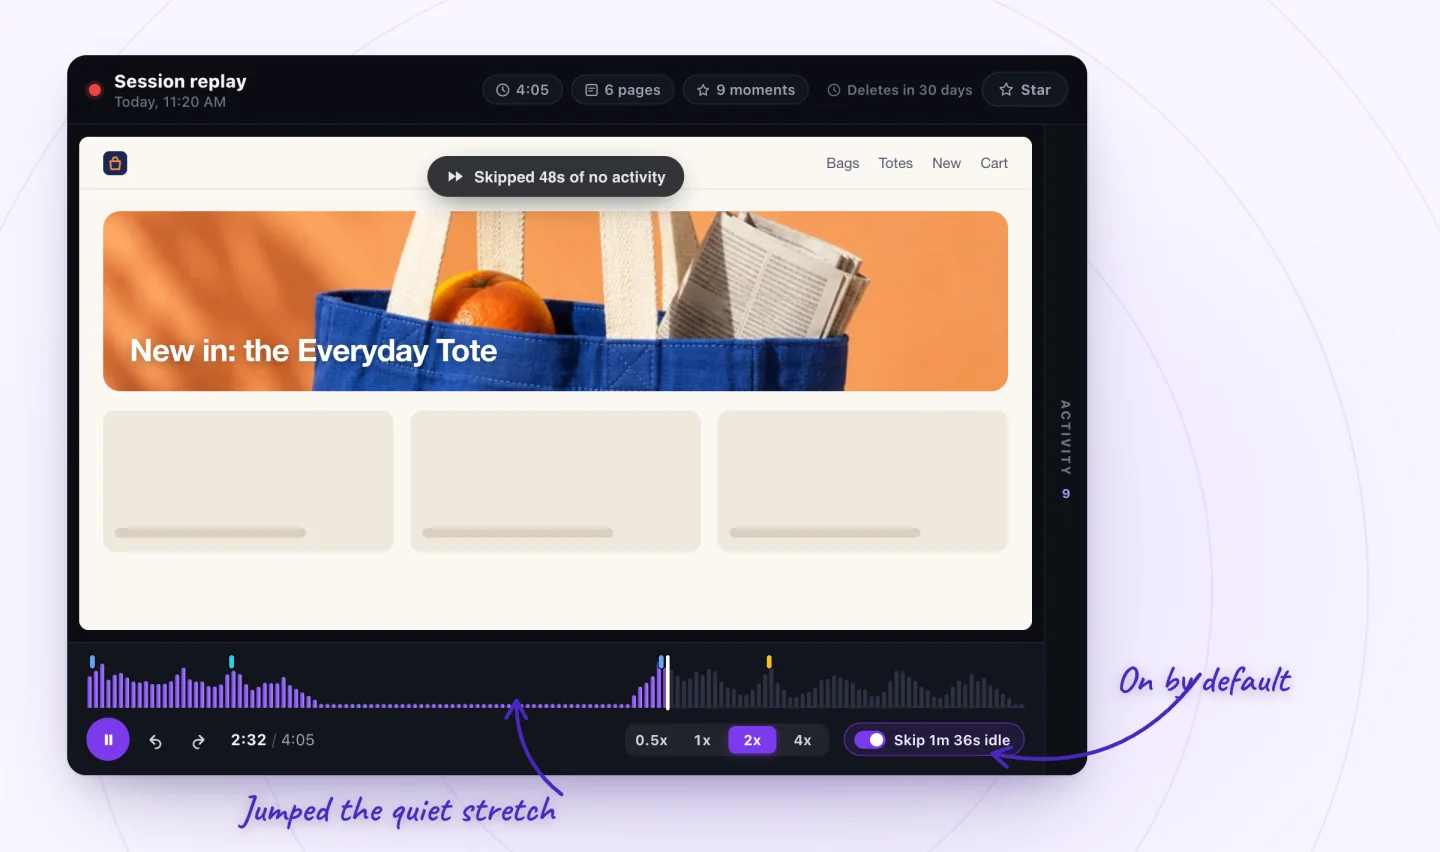
Recordings take the most time per answer, since you watch visits one at a time. In exchange, they give the most specific answers of the three. Filters, marked moments and skipping quiet stretches cut that time down.
Mistakes to avoid
- Treating one replay as a trend. A single visit is a story. Check analytics to see how often the same thing happens before you redesign around it.
- Reading a heatmap across a redesign. If the page changed during the period, old and new layouts blend into one confusing map. Start a fresh map after each change.
- Chasing a number without looking. A drop in analytics can come from a broken button, a slow page or a change in traffic. Watching a few visits tells you which.
- Expecting any of them to explain why. All three show behavior. For reasons, ask people directly, with a one-question survey or a reply to your order email.
If you can only start with one
Start with the analytics that came with your site, if it has some, so you know where people come from and where they leave. Add recordings when you need to see why a number looks the way it does. For a small site, heatmaps can wait, since they need steady traffic to a page before the picture settles.
Getting heatmap-style answers from recordings
You can answer some heatmap questions by hand. It takes a little longer, and you get context a heatmap cannot give you.
- Pick one page. For a product page, filter visits to Viewed a product.
- Watch ten visits that include that page.
- List each element that got a click or tap, such as photos, size buttons or the reviews link, and keep a tally.
- Note where each visitor stopped scrolling.
After ten visits you will know which parts of the page get used, which get skipped, and what happened after each click. With a quick routine for watching replays, ten visits fit in a short sitting.
Frequently asked questions
What is the difference between a click map and a scroll map?
A click map shows where visitors click or tap on a page, with warm colors on the busiest spots. A scroll map shows how far down the page visitors get, with colors fading where fewer people reach. Both are kinds of heatmap that combine many visits into one picture of a single page. Neither shows the order of events in a visit.
Are session recordings qualitative or quantitative data?
Mostly qualitative. A recording shows how one visit unfolded, including where the visitor hesitated, what they tried and what broke. Analytics give quantitative data, such as counts, rates and trends. Heatmaps sit in between, turning many visits into a picture of one page. Use the numbers to decide where to look, and recordings to understand what you find there.
Can session recordings tell you why visitors leave?
Not on their own. A replay shows what a visitor did before leaving, such as pausing at the shipping cost or tapping a button that did nothing. The reason stays a guess until other visits show the same thing or a visitor tells you. Pair replays with a one-question survey or a reply to your order email to hear reasons in visitors' own words.
Try it on your site
Session Recordings replays individual visits, with filters and marked moments to help you find the ones that matter. It does not make heatmaps, so pair it with your analytics. See what a replay includes on the session replay page.

We build marketing apps for online stores: myuser.ai writes and sends emails and texts from a store's own products, and we make Session Recordings and Spin Wheel for Wix sites. Product details in our guides are checked against the apps themselves.